Subscribe to blog updates via email »
October 2024 Income Report
To listen to an audio version of this report, join the Patreon »
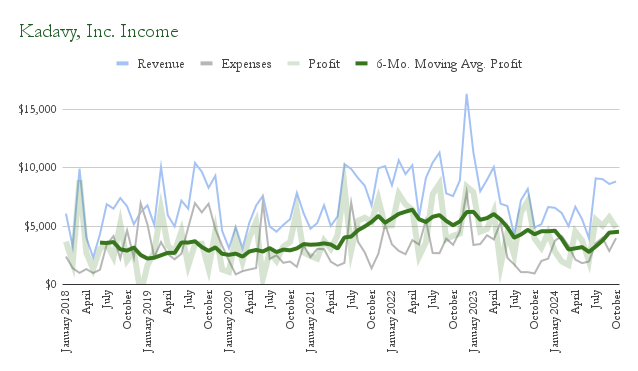
October’s revenue was $8,815, up from September’s $8,606. Profits were $4,853, down from September’s $5,745.

WANT TO WRITE A BOOK?
Download your FREE copy of How to Write a Book »
(for a limited time)
Revenue rebounding, profits stuck
12-month revenue was $81,195, which is the highest it’s been since it was $81,621, in February. However, 12-month profits haven’t moved significantly. This month they’re $45,496.
Book profits rebound (misleading)
12-month book profits, however, have rebounded slightly. This month they’re $39,448, which is the highest they’ve been since December 2023, when they were $42,506. They had dipped as low as $32,638, in April.
But this profit rebound is somewhat misleading. Historically, the only expense I’ve counted against book revenue to calculate profits has been Advertising. That was fine when I wasn’t making many direct sales, but now, the “Book Printing” and “Shipping and Handling” expenses account for a non-trivial portion of book revenue. But, as of yet they aren’t accounted for when I calculate book profits.
How to account for Book Printing and Shipping?
It seems I could simply count Book Printing and Shipping against my book revenue to get an accurate number. But that approach is fraught with other problems. I count Advertising expense against book revenue on a cash basis, which might not be 100% perfect, but is pretty good. Generally, I get billed for ads during the period in which they run. Meta and Amazon, for example, bill at the end of the month.
I assume those charges sometimes don’t get accounted for until the beginning of the next month, just because banking data is sometimes delayed, but through this method I more or less get an accurate picture of how well my Advertising expenses are translating into book revenue.
The anomalies are mostly that some of my Advertising expense is spent growing my email list, with little direct expected impact on book sales. Also, when I run a BookBub Featured Deal, I often pay for the promotion in the month prior to when it actually runs.
Accounting for Book Printing and Shipping as expenses against my Book Income is more complicated. If I account for them on a cash basis, then my expenses become decoupled from the income they generate. I print books and send them to my warehouse, where they wait to be purchased, which can take months. Then once they’re packed and shipped, I don’t get billed until the following month.
The “right” way to account for Printing and Shipping in my book expenses would be to report them on an accrual basis. It’s not a big deal to mix cash- and accrual-based accounting for the purposes of these reports – I report my book sales on an accrual basis. The problem is simply that it would be extra work.
On the surface, all I’d need to do would be, for each direct sale, count the expense of printing and shipping. But that’s not as straightforward as it sounds. The costs associated with each copy of a given book are a little different from the next. Printing costs are relatively stable, but the cost of shipping the book to the warehouse vary. It depends how many copies I’m stocking, and to truly know the expense associated with each copy, I’d have to run a complex calculation attributing a portion of the expense of shipping to the warehouse, according to a given book’s portion of the total weight of the shipment.
For the purposes of these reports, that would clearly be nuts. The alternative, then, would be to have a given “average cost” for each book that I would count as an expense each time a book is sold. I could combine that along with estimated shipping and handling costs to get an approximate profit for each book sold directly.
Estimating direct-sales profits
I’ve just realized I have something roughly approaching this. I estimate profits in a “direct sales” spreadsheet, by approximating printing costs per unit, and approximating shipping and handling costs. For example, I made $1,969 revenue on direct sales in October. After I account for approximate printing costs of the books sold, I made $1,558. 13 of my orders were shipped from my warehouse, and after estimating packing and shipping costs, and accounting for an estimate of shipping fees collected from customers, the estimated cost of sending those books was $47.19, giving me an estimated profit of $1,511.
But that estimate is far from perfect. 35 of the books sold were How to Sell a Book, which were drop-shipped from IngramSpark. I’ve estimated the cost of each book at $9.05, but I don’t know how accurate that estimate is. Because of differences in sales tax by state, and because I don’t have a sales-tax exemption set up with IS, some books cost more, say, $9.44, and others cost less, below $9. This includes shipping.
Also, my estimate doesn’t include the cost of getting books to the warehouse. I guess I could again take a rough estimate of $1.50 per book shipped from my warehouse, which would add another $19.50 of expense, giving me an estimated profit of $1,492.
So, this month, my $1,969 of direct-sales revenue resulted in an estimated profit of $1,492. About 24% of my revenue was expenses. Which could be another way of estimating profit – taking an “average” percentage out of profits, which would be extremely rough, since anomalies show up month-by-month, and I haven’t yet optimized my expenses.
How much accuracy is necessary?
The best way to approach this accounting conundrum relies entirely upon how I want to use my reports to make decisions. To what extent does knowing my exact, or at least better-estimated, profits in direct sales change how I run my business?
I could simply move forward as I am with the mental asterisks on my book profits, and examine my direct sales expenses independently, which is something I do on the per-unit basis, as I analyze printing and shipping and handling expenses.
Or I could try to fix it with the kind of estimate I’ve done above, which then presents another mental barrier, which is, If I start including estimates of printing and shipping costs in my book expenses, what do I do about historical numbers? Do I go back and estimate expenses for all months I’ve been selling physical books directly, or move forward with numbers that were calculated in a very different manner?
To what extent might these unaccounted for expenses be distorting my book-profit numbers? If profits for the previous twelve months are $39,448, and that is $7,000 more than the $32,638 they were in April, how much of that $7,000 could be from printing and shipping books? On a cash basis, the printing and shipping expenses for the 12 months ending in April were $2,299, and the printing and shipping expenses for the 12 months ending in October were $5,483.
So that’s more than $3,000 more I’ve spent servicing that $7,000 difference in income. Damn, that’s nearly half! My all time 12-month book profit high is $56,500, set in January 2023. So in any case I’m a long ways from that, and with my share of sales from direct sales climbing, I need to surpass that quite a bit to really pocket that much profit from book sales.
Direct sales expenses, from past months
Speaking of direct-sales profits, the chickens came home to roost this month on my expenses for the Journal Prompts Workbook Kickstarter, and my pre-orders of How to Sell a Book. My bill came due for the shipping and handling of the Kickstarter rewards, and I printed and shipped the paperback editions of HSB.
So, I paid $975 on “Book Printing,” and $510 on “Shipping and Handling.” Due to some limitations in my reporting, some of that book-printing expense is also shipping, as I drop-shipped the paperback editions from IngramSpark, which allowed me to provide a pre-order discount.
Also, some of that book-printing is actually shipping costs for getting books to my warehouse. Finally, some of that book-printing is inventory that is now in my warehouse, waiting to be purchased.
Physical product sales, and bundle attribution
Another accounting conundrum I’ve run into has been how to estimate revenue generated by physical products, and how to divide up revenue when products are sold in a bundle.
For example, the 100-Word Journaling Habit Starter Kit consists of the 100 Journal Prompts Workbook, the 100-Word Writing Habit Paperback, and the Habit-Tracking Wristband. So if someone buys that for $39, how much revenue should I attribute to each product?
The way I’ve devised to split up revenue is by calculating a “percentage of value” for each item in a bundle. The percentage of value is calculated by each item’s list price relative to all list prices of all items in the bundle, combined. So for the Journal Habit Starter Kit, the Workbook itself has a list price of $24.95. The other items in the bundle add up to a list price of $24.99, so of the $39 price of the bundle, 50% is attributed to the Workbook, 32% is attributed to the Paperback, and 18% is attributed to the Wristband.
This method begets a spreadsheet for breaking down the revenue from all direct sales into individual sales and proportion of bundle sales. This also helps me break out physical products, such as the Wristband and Book Plates, so they aren’t attributed to book sales. So the $1,969 I made on direct sales in October were actually $1,946, because $23.06 of revenue was attributed to the Wristband.
Damn, this shit gets complicated. Maybe I need an app for that.
Direct sales still growing
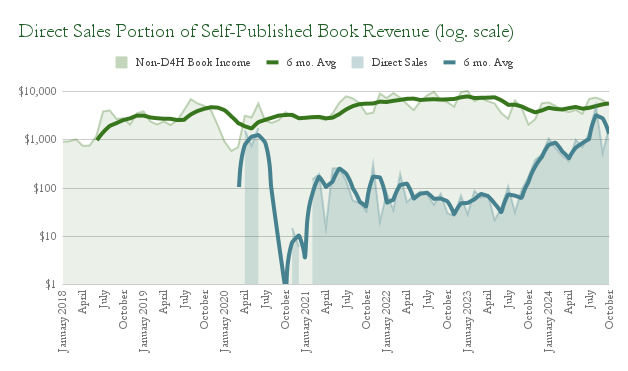
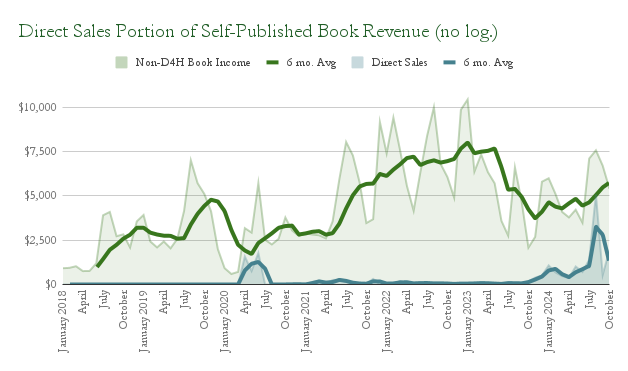
This month, the direct-sales share of my book revenue was 36%. That’s not as high as August’s record of 67%, but my 6-month average has climbed to an all-time high of 31%.
At the beginning of the year I predicted with only 30% confidence that I could grow my 6-month direct-sales share of book sales to 30% by the end of the year. Though I’m currently above that threshold, this share has been propped up by both a recent Kickstarter for the Journal Prompts Workbook, and the launch of How to Sell a Book, so it still remains an unlikely outcome.
But it’s very cool to see how my direct-sales share looks on the graph without a logarithmic scale!
Direct sales continuous improvement
Bit by bit, I’m trying to create frameworks to continuously improve my direct sales, without distracting myself too much from the crucial work of actually writing books.
One way I’ve done that is simply by identifying “departments” of my direct-sales operations. For example, Analytics lives within the Marketing department, and Shipping lives within the Logistics department.
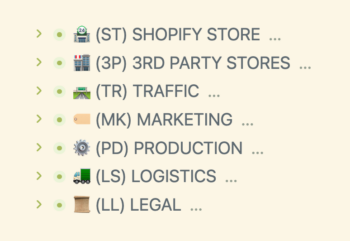
The biggest material impact this has is simply that my project notes associated with direct sales are organized by a directory structure that follows this schema.
This somehow has the effect of reducing my cognitive load when I think about direct sales. There is no limit to the things you can think about when running direct sales, but not all efforts will have the same payoff, and you’ll run out of things to sell if you stop writing books!
I’ve also begun following a schedule to try to make the most of my efforts. Depending on the day of the week, I focus on certain things. Like so:
- Mondays: Fill the funnel (with free traffic)
- Tuesdays: Fill the funnel (free)
- Wednesdays: Fill the funnel (paid)
- Thursdays: Fatten the funnel
- Friday: Put the needle on a pivot
By analyzing my sales funnel over the past several months, I’ve found that probably the best way to increase revenue is to simply increase traffic to the store. So that’s “filling the funnel.” Yes, I can increase revenue by increasing conversions or AOV, which would be “fattening the funnel.” But playing with the numbers, it seems more difficult to have as much impact as simply bringing more traffic. To mix metaphors, these activities should “move the needle,” but I can’t move the needle, or even know if the needle is moving, if the needle isn’t on a pivot. So I need the store to work and have reliable analytics.
It’s tempting to just buy ads instead of finding free ways to do that, so I’ve specifically reserved Mondays and Tuesdays for finding free ways to fill the funnel. So if it’s Monday and I think about optimizing a Meta ad, I can’t do it. That’s not filling the funnel with free traffic. If it’s Tuesday and I have an idea to decrease cart abandonment, sorry, that has to wait until Thursday.
This schedule is actually designed to create a bias for finding free ways to fill the funnel. If I’ve spent Monday and Tuesday making a video, for example, chances are I’ll think about and maybe work on it even more the rest of the week.
This is a similar concept to the mental-state-based schedule I wrote about in Mind Management, but instead of the focus being on mental state, it’s on what will create the results I desire.
I’m only a couple weeks into using this schedule, and I’m sure it will evolve. I’ll shift my focus to writing the next book, but now it feels mission-critical to build up robust and sustainable direct sales that I can manage with minimal cognitive overhead.
New YouTube video: 100,000 sales breakdown
The first week I tried this new funnel-filling-heavy schedule, I worked on my newest YouTube video, in which I break down my sales and earnings from 100,000 self-published books.
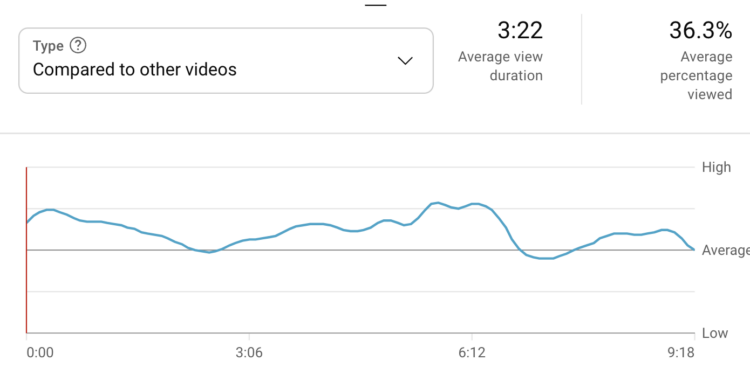
I was inspired to create this video by my friend Paul Millerd’s video about selling 50,000 copies of The Pathless Path. Paul was nice enough to send me his engagement graph, and I noticed engagement was highest when he was talking about either cumulative sales, or earnings.
Paul’s video was pretty wide-ranging, but I decided to make mine only about revealing sales numbers and earnings. To try to keep it engaging, I made a bit of a game out of it for the viewers: Could they guess which books did well, and which didn’t? There’s a wide range of sales numbers in my catalog, from just over 100 copies, to well over 40,000.
The video has only been out about a week, and has 345 views. I don’t know whether that’s more or less than I had expected, since I didn’t make a prediction. I do expect that it will take at least a few more weeks for views to pick up, as YouTube’s algorithm learns who the video is for. But, I at least know the engagement is higher than the average video on YouTube.
My YouTube “channel,” it feels so weird and 2024 to call it that, is more than sixteen years old, and has a wide range of content. My most popular video, with more than one million views, is about how to do laundry in your sink. So the 5,000+ subscribers I’ve accrued have nothing to do with self-publishing per-se.
So I know I’m doing it “wrong,” and the YouTube algorithm is probably very confused about who my video is for. I have ideas for other self-publishing related videos, and I hope I get around to making them, but I don’t have plans to curate my “channel” to be about any one thing in particular.
One thing that I don’t think has performed to expectations is tagging of products in my video. Had I made a prediction, I probably would have expected a sale driven by the video by now, of How to Sell a Book. Though it’s possible a sale has been driven in channels outside my Shopify store.
Final Cut Pro chops improving
This video was my most-advanced use of Final Cut Pro yet. I’ve intended to get more serious about video for years now. That has happened, but it has been a very slow process. My biggest breakthrough was getting a mirrorless camera for Zoom calls about a year ago, which I now use for videos (and photography for my store!).
But now I’m becoming pretty comfortable to Final Cut Pro, to the point that I actually enjoy editing video. The editing on this latest video is still pretty basic relative to a lot of what’s on YouTube, but I used techniques I hadn’t before, such as putting my head in a circle, and got more comfortable with techniques I had used before, such as panning around the screencast with keyframes.
By the way, if you’re interested in learning Final Cut Pro, I shared my very favorite keyboard shortcuts for editing quickly and efficiently in the latest Patreon bonus, Final Cut in Five.
Adventures in thumbnails
This latest video was also a step up in my efforts to make engaging thumbnails, which I’ve learned are a big deal to succeed on YouTube. I did a lot more brainstorming than usual on both my thumbnail and title, and I’m using for the first time YouTube’s built in thumbnail split tester. Here are the numbers so far.
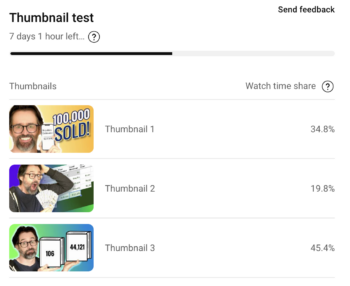
I’m really not pleased with these thumbnails. My overall thumbnail CTR is below 3%. I know it could be much better, but I don’t know to what extent it’s being diluted by the algorithm learning, and the thumbnail test.
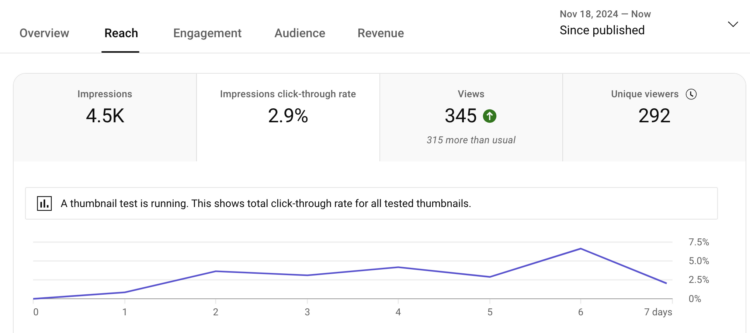
Once this thumbnail test is over I intend to do another round of them, and hopefully I can improve the quality and CTR.
New on Patreon: Final Cut in Five
This month on Patreon, I’ve shared a bonus screencast showing how to quickly and easily use the most important features in Final Cut Pro.
I’ve improved my video-editing skills over recent years, a lot, I think, relative to how much video I actually produce. Being comfortable with Final Cut Pro, and therefore not dreading video editing, is increasing the extent to which I use video to grow my business.
I’ve been trying to add at least one new piece of bonus content per month since February, just for Patreon supporters. Some other recent additions:
- My carry on travel packing and gadgets
- How I use Todoist for GTD and Mind Management
- A tour of my Shopify store & Meta ads
- and many more…
Join the Patreon to get instant access to all these, plus audio versions of these reports. (Join through the website, not the iOS app, to avoid higher fees.)
Income
Book Sales
| Mind Management, Not Time Management Kindle | $401 |
| Mind Management, Not Time Management Paperback (Amazon) | $806 |
| Mind Management, Not Time Management (non-Amazon) | $452 |
| Mind Management, Not Time Management Audiobook | $482 |
| 100-Word Writing Habit | $572 |
| 100 Journal Prompts Workbook | $89 |
| How to Sell a Book | $1,335 |
| Digital Zettelkasten Kindle | $431 |
| Digital Zettelkasten Wide (non-Kindle) | $324 |
| Digital Zettelkasten Audiobook | $162 |
| The Heart to Start Kindle | $81 |
| The Heart to Start Paperback (Amazon) | $49 |
| The Heart to Start “Wide” (non-Amazon) | $68 |
| The Heart to Start Audiobook | $86 |
| How to Write a Book Kindle | $21 |
| How to Write a Book Paperback | $11 |
| How to Write a Book “Wide” (non-Amazon) | $5 |
| How to Write a Book Audiobook | $35 |
| Total Book Sales | $5,409 |
Misc. Products
| 100-Word Habit Wristband | $23 |
| Signed Book Plates | $0 |
| Total Misc. Products | $23 |
Affiliates / Advertising
| Active Campaign | $3,021 |
| Alliance of Independent Authors | $0 |
| Amazon | $77 |
| Google AdSense | $145 |
| Total Affiliates | $3,244 |
Reader Support
| Patreon | $139 |
| Total Reader Support | $139 |
Services
| Clarity | $0 |
| Medium | $0 |
| Total Services | $0 |
| GROSS INCOME | $8,815 |
Expenses
General
| Accounting | $35 |
| Book Printing | $975 |
| Outside Contractors | $0 |
| Quickbooks | $32 |
| Shipping and Handling | $510 |
| Total General | $1,551 |
Advertising
| Amazon | $1,322 |
| BookBub | $0 |
| $3 | |
| Meta | $571 |
| Influencer Marketing | $0 |
| Product Samples | $131 |
| Total Advertising | $2,028 |
Hosting
| ActiveCampaign | $150 |
| Bookfunnel | $24 |
| Drafts | $2 |
| Dropbox | $10 |
| Fathom Analtyics | $14 |
| Libsyn | $5 |
| Namecheap | $0 |
| Obsidian Publish | $10 |
| SendOwl | $9 |
| Shopify | $39 |
| Ulysses | $3 |
| WP Engine | $96 |
| X (Twitter) | $8 |
| Zapier | $14 |
| Total Hosting | $384 |
| TOTAL EXPENSES | $3,962 |
| NET PROFIT | $4,853 |


