Subscribe to blog updates via email »
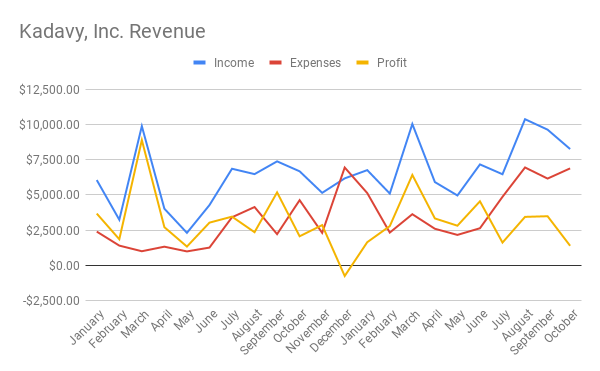
October 2019 Income Report
An audio version of this income report is available to Patreon backers of certain levels »
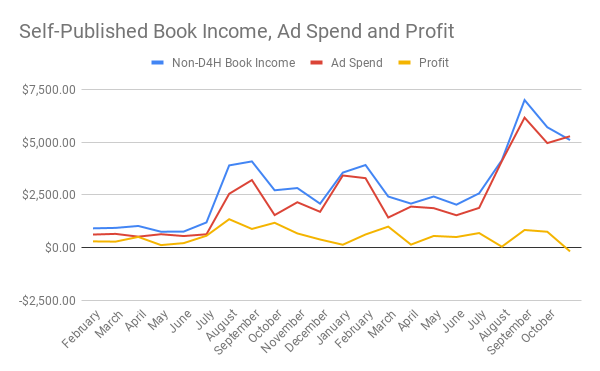
October’s revenues were $8,278.66, down from September’s $9,161.16. Profits were $1,365.74, down from $3,487.87.
WANT TO WRITE A BOOK?
Download your FREE copy of How to Write a Book »
(for a limited time)
October was the first month in which I spent more on advertising my self-published books than I made selling those books. I spent $5,293.72 on advertising, and made $5,113.26 in royalties. That’s a loss of -$180.46, and ROI of -3.41%.
Why the negative profit in self-published books?
I suspect this drop in profit on ad spend is from one of four potential things: Wider distribution of Lockscreen Ads, a performance penalty from other books in my catalogue, ad fatigue, or some other thing.
I experimented throughout October with wider distribution of Lockscreen Ads. I generate Lockscreen Ads like so: I have a spreadsheet I’ve created, populated with various ad creatives, target categories, and a bid range. This spreadsheet randomly constructs a collection of ads that my assistant then places.
Wider distribution of Lockscreen Ads?
I really pushed this random-Lockscreen-Ad-generation process in August, which would explain why that was my highest ad-spend month ever. I’ve since widened the categories that are candidates for targeting. I even have totally irrelevant categories, such as “Teen Social Issues.”
I still don’t know whether or not to trust Amazon’s reporting on Lockscreen Ads. It’s amazing how well an ad can “perform” – according to Amazon’s reporting – in a totally irrelevant category. For example, in “Personal Health,” I have an ad with an ACoS of only 68.87%.
When you consider that Amazon takes a 70% cut of sales on Kindle books, that doesn’t sound that impressive, but my past performance suggests that I can still turn a profit while a good portion of my ads have an ACoS above 130%.
Monitoring Lockscreen Ads by ACoS
Which brings me to another element of my ad-placement process that I’ve been experimenting with. Throughout October, I instructed my assistant to check the performance of Lockscreen Ads twice a week. If the ads were above a target ACoS, they were to turn the ads off. If the ads were below a target ACoS, and turned off – because new sales had been reported since it was turned off – they were to turn the ad back on.
My target ACoS for October was 100%. This was a much more conservative play than usual. I have been less formal in the past, but generally, if an ad was returning an ACoS of 130% or less, I kept it on.
One element that may distort the performance of this process is the point at which ads qualify to be moderated in this manner. My assistant is instructed to only moderate ads that have at least 100 clicks. It’s possible that I’m spending a lot of money on ads that still have fewer than 100 clicks, and thus my repertoire of Lockscreen Ads isn’t yet optimized enough.
Obviously, I’m pretty unscientific and sloppy with these Lockscreen Ads. I have some semblance of experimentation going on, but I’m not isolating variables at this point.
The unsolved – and perhaps unsolvable – mysteries of Lockscreen Ads
The main questions that remain in my mind about Lockscreen Ads are:
- Can the reporting on Lockscreen Ads be trusted? As such, is it better to moderate ads according to a target ACoS, or is it better to follow an “a click is a click is a click” philosophy, which Brian Meeks advocated for in Mastering Amazon Ads (back when the closest thing to a Lockscreen Ad was a “Product Display Ad.”)
- Does category relevancy matter? This dovetails with the above question. If I advertise my Self Help book in Science Fiction, and it’s generating a ton of clicks and/or a great ACoS, should I trust it?
- To what extent do Lockscreen Ads influence Sponsored Product ads? When I spend a lot on Lockscreen Ads, and generate a lot of sales, my Sponsored Product ad spend goes up, too.
- Is there any happy medium for generating more organic sales through Lockscreen Ads? High Lockscreen Ads spend and sales leads to high Sponsored Product ads and sales, but so far a “sweet spot” in terms of overall ROI is hard to find. Perhaps sticking only to the most relevant categories would improve organic sales, by focusing the “also-boughts.”
The difficulty of testing Lockscreen Ads
I could do some amount of more rigorous testing on these questions. For example, I could test an “a click is a click” philosophy versus a “filter by ACoS” philosophy.
However, trying to do so would present a couple of challenges: Impressions, clicks, and sales can be slow to come in, even after ads have been turned off. I would need to keep all adds turned off for a time to get clean data.
Additionally, seasonal changes would make the tests a challenge. With the holiday shopping season coming up, I can’t expect anything I see for the next couple of months to translate very well into the rest of the year.
Testing a “filter by ACoS philosophy” would also beg the question, “at what target ACoS?” Having a target of 75% versus 150% could bring wildly different and possibly counterintuitive results. (Maybe I actually have better results at a 150% ACoS, as compared to 75%).
Basically, I don’t quite have the patience to really scientifically test Lockscreen Ads on HTS. Perhaps I can eat some costs and run some experiments with one of my other books.
A performance penalty for publishing low-sale short reads?
Which brings me to another potential reason for the lagging performance of my ads: That of a performance penalty for other books.
I have been publishing lots of short reads on Amazon. I don’t market them very aggressively. So, they don’t get a lot of reviews, and they don’t get a lot of sales.
When I started publishing short reads, some speculated that it might make Amazon’s algorithms unhappy to see me publishing lots of short books, or lots of books that don’t make many sales or attract many reviewers.
This drop in performance also corresponds to the debut of a new short read. Ten Passive Income Ideas debuted on September 30th.
However, Ten Passive Income Ideas is not my only short read with few sales or reviews. In Defense of Papyrus also doesn’t have a lot of activity. Publishing it didn’t correspond with a noticeable drop in performance.
Because of confounding factors, it’s hard to know if this has anything to do with my drop in ROI. It’s just speculation at this point.
I do plan to do some kind of promotion for my short reads, to improve their performance. I’ll be looking out to see if I notice a concurrent improvement in my HTS sales.
Other reasons for the losses?
That leaves to other possibilities: Ad fatigue, and “some other thing.” Maybe people who were going to be influenced to buy from my ads have done so, and the rest are tired of seeing it. Or, maybe it’s some other things I haven’t thought of. “Unknown unknowns.”
Drastically cutting back on ads
With this dismal performance, and after thinking through some of the above, I decided, in early November, to drastically cut back on ads. I killed all but the best-performing Lockscreen Ads, and I reduced my Sponsored Product campaigns down to the “big three” for using the method Prestozon recommends.
That is: an automatic campaign, a “research” campaign, and a “performance” campaign each for HTS and WAB.
Prestozon automated bids for “Research” campaigns
One thing I discovered while doing this is that I was bidding a lot for keywords in my performance campaigns. This is because I had automation turned on for these campaigns. So, I had a lot of broad keywords whose bid trend looked like this:
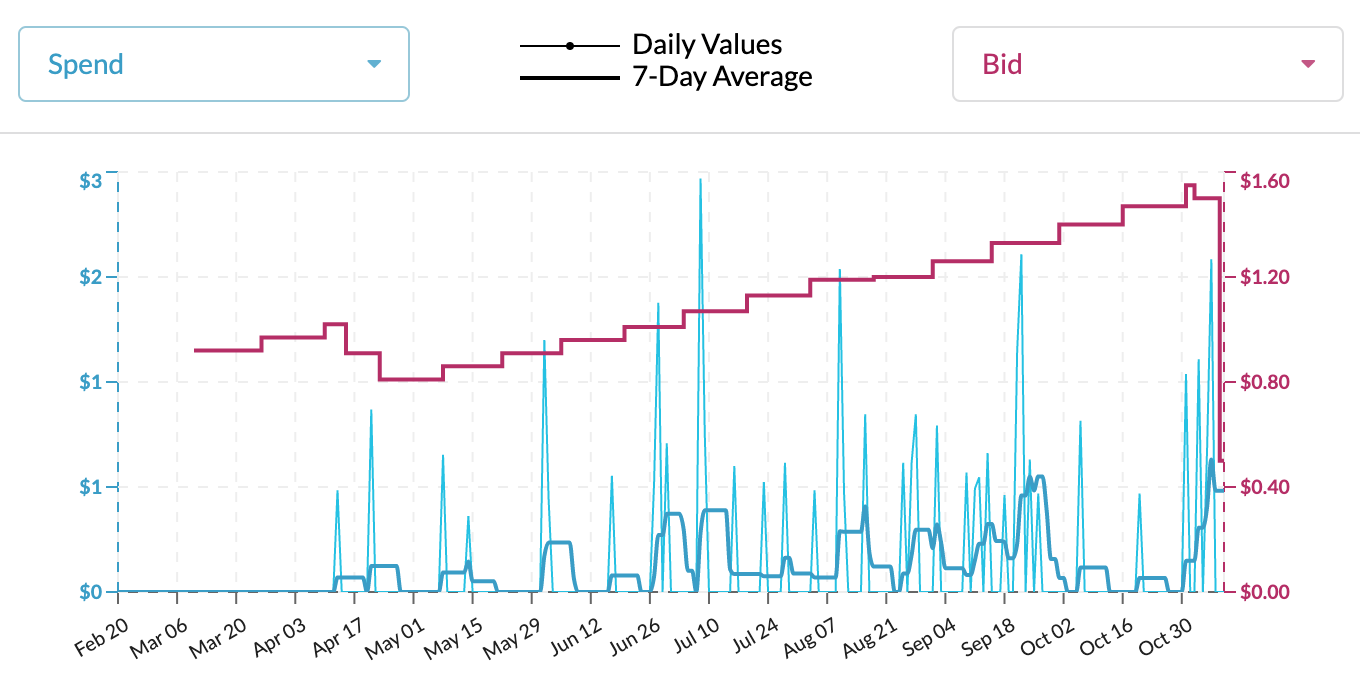
I know that Prestozon recommends against using automation for research campaigns, but I did it anyway, for about a year. The idea was that I could spend a lot, collect a lot of data, then cut back and re-focus my efforts using that data.
So, that’s exactly what I did. I turned off automation on these research campaigns, and cut back my bids drastically.
Prestozon automated bids for “Performance” campaigns
I still have automation on for the performance campaigns. Thanks to my aggressive spending, these campaigns are now filled with lots of exact-match keywords that have actually led to sales. So, Prestozon is automatically searching for the ideal bids for these keywords.
The challenge of getting enough data to adjust bids
One thing that’s being reinforced by this process is the fact that it’s very hard to get enough data to know whether a keyword is really working or not. I imagine that the number of keywords that can lead to a sale of a book is far wider than the number of keywords that can lead to a sale for a regular item, such as a “top hat.”
Plus, there’s so little volume on any one of those keywords, there just isn’t enough data to find many winners. It still feels like a crapshoot.
However, I’m still happy with this three-campaign model. I basically left my Sponsored Product ads on auto-pilot for nine months, and now have a ton of data to go on. Meanwhile, Prestozon will still be optimizing my bids.
One-month Prestozon free trial
Prestozon now finally has an affiliate program. You can get one month free of Prestozon with the code KADAVY. I’m warning you though, it’s not for the faint of heart. It can be intimidating. If you’re up for it, try it out.
Leveraging Descript to improve the podcast
There’s a good chance you’ve seen the introductory video for Descript floating around the web.
Descript automatically does a good-enough transcription of spoken audio. You can then edit the text of that good-enough transcription, and when you edit that text, it edits the audio.
It feels incredibly obvious once you use it that this is the future of editing spoken audio. So, I plopped down $14 to try it for a month (currently under “Miscellaneous Software”).
Since most podcasters will probably be slow to start using Descript, it got me wondering how I might use it to improve the podcast with minimal extra labor, and thus get an edge.
So, I have experimented with using it to edit audio, and to better-digest my episodes as I work on them.
Descript for better audio clips
Descript makes it much easier than it otherwise was to find “golden nugget” audio clips within a conversation. I can copy and paste these passages, and easily edit them down, to make them even snappier.
I’ve experimented in the past with finding these clips to use either as a teaser for a cold-opener at the beginning of the episode, or as a clip to share on social media. I’ve also used teasers to get listeners excited about upcoming episodes on the podcast.
Each of these things obviously improves the podcast and its prospects somewhat. The question has been whether the payoff – which is too small to detect in the short-term – is worth the extra labor.
So far, I’ve used Descript to make a cold opener and social media clip for the newest Dan Ariely episode.
https://www.instagram.com/p/B4kebZ1pBsg/
As expected, I can’t trace this extra effort to any lift in downloads. But, if I can make such clips with minimal effort, as part of my regular production process, they may be worth it.
Descript for better-digesting interviews
Additionally, putting more thought into digesting these conversations, can help improve my intros, and my future episodes. If I can see what kind of content resonates with people, I can adjust my interview approach so that I can create more of these moments.
Again, this could all be futile, so I’m trying not to spend too much time and effort on this. The chances of these efforts turning into money anytime soon are very slim.
I’m tempted to continue to try to just keep my production process as lean as possible, and reap the other benefits I get as a podcast host, such as and improved network, and an intimate connection with the listeners who I already have.
Descript for better ads
However, not all of my Descript usage was so hard to justify. It was invaluable in generating the spots I created for my highly-integrated campaign for sponsor, Offgrid Mindfulness (their Awake Mindfulness Clock is truly awesome, and you can get 10% off with the code LOVEYOUWORK).
Listen throughout November for those spots. I think they’re really cool, and a step forward in sponsorship on the podcast.
My new voice double
Additionally, I was accepted into the beta program for Overdub – which makes a voice double you can use in Descript. The main motivation for applying was a word I misspoke during an interview, which I wanted to change.
I supplied Descript with several hours of audio of me speaking, and within a couple of weeks, I had a voice double. It worked great to fix the word.
Talking with @nickkokonas, I accidentally said "mean." What I meant to say was "median."
Thanks to my @DescriptApp Voice Double, I didn't have to go back in the studio to fix it.
Amazing. Our conversation was even recorded in a different environment than my Voice Double. pic.twitter.com/OKOsvNpV6d
— ? David Kadavy | Time ?? Mind Management (@kadavy) November 14, 2019
I’ll also be using the voice double to do some of my intros for the month of December, while I take my usual end-of-year break.
Blog 2 BLING! results are in!
The latest iteration of my Self Motivation for Solopreneurs webinar went well, and Blog 2 BLING! Is now successfully hosted on Teachable.
I booked a total of $4,017 in revenue with this launch. (Note that only $1,197 is booked in October.) So, how does that compare to my predictions from last month?
Last month, I predicted with 70% confidence that my revenues would be between $4,550 and $6,500.
Obviously, I fell outside of that range. Where did I go wrong in my prediction?
Subscriber engagement
I predicted a 30% increase in performance for more-focused subscribers. Additionally, I predicted a 50% increase for more-engaged subscribers (a “warmer” list, from Love Mondays emails). Those combine to a 95% increase.
I can use email open rates as a reasonable proxy for testing that. My first email had an open rate of about 35%. In the previous launch, my first email had an open rate of about 21%. That’s a growth of “only” 67%.
Offer desirability
I predicted that the improved product experience would increase conversions by 50%, the landing page another 50%, and that doubling the price would drop the conversion rate about 30%. Those combine to make a 58% increase in sales.
Additionally, I predicted a 10% decrease in sales from doing only one webinar, but a 5% increase for doing my webinar (and cart close) on Sunday night. That brings us to a predicted 49% increase in sales.
In the previous launch, I had 16 customers from 23,000 leads, for a 0.06% conversion rate. On this launch, I marketed to only 7,800 leads, and had 12 customers. That’s a conversion rate of 0.15%.
We’re working with incredibly small numbers here, but that is an increase of 150%!
Way over my estimate! This is based upon the total number of leads, so the open rate doesn’t really interact with this number. So, I can’t use my short prediction on open rate to explain why my estimate was still low.
Pricing structure
I expected a 30% drop in dollars per sale from having neither tiered pricing nor upsells. I made $216 per sale in the previous launch. In this launch, I made $334.75 per sale.
That’s a 55% increase in dollars per sale!
A couple problems there. One, my prediction was weird, because I was doubling my price, yet expecting a drop in dollars per sale. Which makes no sense.
I wasn’t thinking that through. I could adjust for my doubling, so 2 x 0.7% (30% decrease), would predict a 40% increase in dollars per sale. Not far off!
Second, I actually did have tiered pricing. As I mentioned while writing last month’s income report, seeing my estimates motivated me to work harder on the launch.
It wasn’t straightforward to add tiered pricing and upsells with Teachable, but with some ingenuity and Zapier magic, I was able to make it work.
So, I predicted what was essentially a 40% increase in dollars per sale from a combination of the drop from not having tiered pricing and having a higher price. But then I actually did do tiered pricing, and my dollars per sale was another 38% higher, for a total of a 55% increase.
So maybe having tiered pricing and upsells did increase my dollars per sale by 38%. If so, my 30% decrease prediction wasn’t far off.
Number of sales
I predicted 10 sales. I actually had 12, probably because I had tiered pricing.
Payment plan vs. up-front
I predicted half of those sales to go for the $99 x 6-month payment plan. In actuality, none did. 5 did pay $499 up-front. The other 7 bought the $199 basic plan. 2 people bought up-sells, for added revenue totaling $129.10.
Where was my estimate off?
The higher performance in number of sales was probably due to having tiered pricing. That tiered pricing also decreased the dollars per sale.
Maybe some of those who bought the Basic package would have bought the Premium package, if that had been the only choice. Then again, without tiered pricing, it’s possible that some who bought the Premium package would have bought nothing at all.
One area where there was a problem was with the payment plan pricing. I guess that extra 19% wasn’t enough to trade for the convenience of a payment plan.
$89 for 6 months would be only a 7% premium – which isn’t enough to risk breakage. $95 x 6 would be a 14% premium. That feels solid, but $95 doesn’t feel like a strong price point. Maybe I’ll try it anyway, next time.
Still, $4,017 is pretty solid. Going through the prediction exercise really fueled my motivation. That got me to put in some extra work and effort to get Teachable to work with multiple product tiers, and some upsells.
That’s kind of the whole basis behind what I teach in Blog 2 BLING! How to operate so that you can motivate yourself to do the work.
Scoring my revenue prediction
I’d say doing predictions is a good practice. I’ll do it again. However, I’m still not sure how to “score” my prediction. Would being in the correct range be a “score” of 0.7? (Since I would have been 100% correct within a 70% confidence range.)
How do you score it when you’re outside of that range? Maybe it’s the difference between your actual performance and the bottom or top of your range?
For example, my prediction range started $533 higher than my actual performance. $533/$4,550 = 0.117. Is my “score” then 0.7 – 0.117, or 0.583?
What if I had been $533 higher than my range? Would I then calculate off of the top part of my range? $533/$6,500 = 0.082. Would my score then be 0.618?
As you can see, with this method, being off by the same amount affects your score differently, whether you’re high or low.
Alternatively, I could score based upon the distance from the midpoint. My midpoint was $5,500. Actual revenue was $1,483 less than that. $1,483/$5,500 = 0.27.
Since calculating by midpoint makes it possible to have a perfect score of 1, I would subtract from that. My score would thus be 0.73.
Interesting. That’s even better than the 0.7 score that I would get if I had merely been in the bottom part of my range with the other method. So, what would scores look like on the top and bottom parts of the range?
$4,550 would be $950 less than $5,500, and would score 0.83. $6,500 would be $1,000 more, and would be a score of 0.82. So, before rounding to the second decimal point, the top and bottom of the range would be roughly the same score.
I think this latter method seems more accurate. There’s a chance of a perfect score, and I do feel like my actual performance of $4,017 feels more like a 0.73 than it does a 0.58.
Then again, if we’re scoring solely on distance from an exact-dollar prediction, what purpose does having a 70% confidence range serve?
There’s more to think about here. I’ll try it more in the future. Of course, the ultimate purpose of making predictions like this is to sharpen your thinking. Is an exact-dollar prediction so intimidating as to discourage rigorous thinking? Does falling within a 70%-confidence range deserve a perfect score of 1, just for the sake of feeling better, and encouraging rigorous thinking?
Stay tuned. Let me know if you try something like this for one of your product launches.
Webinar: Bust Through Creative Blocks
Here’s another opportunity for me to make a prediction. I’ll be giving a live webinar in the beginning of December. Bust Through Creative Blocks will show you the actual techniques I’ve built up over the years for breaking down blocks, on demand.
I continue to work at the systems for running webinars. I had an ActiveCampaign automation from the last time I ran this webinar, which I copied and made some changes to. My favorite ActiveCampaign feature, Message Variables, made the process pretty easy.
I put off re-running webinars way too much. But through repetition and systems, I’m making it easier to make them happen.
Predicting D4H Video sale revenue
So, I guess I need to make a prediction about what I’ll make with this webinar.
The last time I ran this webinar was more than a year ago, in October 2018. I booked $1,216 in revenue.
The first email I sent to promote that webinar went to 18,941 people, and had an open rate of 13.84%. It generated 6 up-front sales and 3 payment plan sales. So there was a 0.05% conversion rate, with $135 generated per sale.
I already sent the first email to promote this webinar, and it has an open rate of 18.24%. That’s a 32% increase (though opens are still coming in). I’m now more strict with only sending design content to my D4H list, and I’ve cleaned the list a bit. So, there’s more engagement, but it could be higher if I kept the list “warmer.” They aren’t getting a weekly Love Mondays email, as B2B customers were getting before last month’s launch.
That email went to 15,075 people, so that’s a 20% decrease in audience size. Like I said, I’ve cleaned the list.
I expect a 15% increase over past performance, for the longer passage of time between webinars. This time, it’s been more than a year since my previous live webinar. Previously, it had only been six months.
I expect a 20% increase over past performance for the launch happening during the week of Cyber Monday.
Confounding those factors brings a 146% increase in performance.
My 70%-confidence revenue range is $1,506.24–$2,037.86, with a midline of $1,772.05.
I made a spreadsheet this time, to help me with these calculations. I can use it for future launches, and tweak, if needed.
Still working on my prediction methodology
While this looks very scientific, much of it is not. I’m eyeballing my prediction range, as well as my factors, tweaking to get something that looks plausible.
This time, I’m also trying to give myself more of a chance of erring on the low side. A $2,100 launch would be surprising, but not out of the question. I’m not sure if I should miss on the high side as often as I miss on the low side. Maybe positive Black Swans would be more common than negative ones?
The things I’m deciding not to do
I brainstormed lots of potential changes to the product and sales process, such as adding the course to Teachable, or raising the prices, but seemingly small changes like that have big implications, affecting many things in the business, and creating way more work than I would have expected, if I hadn’t thought it through.
Since D4H is not a main focus for me, I decided not to go through with those changes for now. Now that I’ve done this estimation exercise, I feel even more confident in that decision. It’s too little potential for revenue growth, down a road that doesn’t meet my larger mission.
Sunsetting ODMM
Speaking of things that don’t meet my larger mission, last year around this time, I intentionally killed off one of my passive-revenue sites. It was bringing in some money, but I saw it as a distraction. I didn’t want thinking about it to blind me from the opportunity costs of thinking about it.
Now, the time has come to kill off my online-dating-advice blog. It’s brought in around $300 in 2019. I could try to sell it, but again, I don’t want it to distract me from my core mission.
It’s an emotional experience to say goodbye to this site. I made more than $150,000 in the past decade. If it wasn’t for this site, I wouldn’t have been able to focus on writing and promoting Design for Hackers as intensely as I did.
Income
Book Sales
| The Heart to Start Kindle | $2,965.27 |
| The Heart to Start Paperback (Amazon) | $876.39 |
| The Heart to Start “Wide” (non-Amazon) | $86.76 |
| The Heart to Start Audiobook | $180.85 |
| How to Write a Book Kindle | $378.80 |
| How to Write a Book Paperback | $499.65 |
| How to Write a Book “Wide” (non-Amazon) | $3.00 |
| How to Write a Book Audible | $41.68 |
| How to Write a Book Spanish Kindle | $2.76 |
| How to Write a Book Spanish Paperback | $0.00 |
| In Defense of Papyrus Kindle | $4.77 |
| In Defense of Papyrus Wide | $0.00 |
| Make Money Writing on the STEEM Blockchain Kindle | $2.08 |
| Make Money Writing on the STEEM Blockchain Paperback | $3.84 |
| Make Money Writing on the STEEM Blockchain Audible | $1.93 |
| Ten Passive Income Ideas | $65.48 |
| Total Book Sales | $5,113.26 |
Digital Products
| Blog 2 BLING! (Beta) | $1,197.00 |
| D4H Video | $369.00 |
| Logo Mastery | $49.00 |
| Summer of Design | $12.00 |
| Total Digital Products | $1,627.00 |
Affiliates / Advertising
| Active Campaign | $981.55 |
| Amazon | $99.98 |
| ConvertKit | $62.10 |
| Hostgator | $100.00 |
| SendOwl | $4.80 |
| Total Affiliates | $1,248.43 |
Love Your Work Podcast
| Patreon | $254.05 |
| PayPal Donations | $10.00 |
| Total LYW Podcast | $264.05 |
Services
| Medium | $25.92 |
| Total Services | $25.92 |
| GROSS INCOME | $8,278.66 |
Expenses
General
| Accounting | $215.00 |
| Outside Contractors | $296.87 |
| Podcast Editing / Publishing | $240.00 |
| Misc. Software | $24.53 |
| Total General | $776.40 |
Advertising
| Amazon | $5,201.02 |
| BookBub | $4.91 |
| $7.79 | |
| Prestozon | $80.00 |
| Total Advertising | $5,293.72 |
Hosting
| Bookfunnel | $15.00 |
| EverWebinar | $297.00 |
| Genius Link | $10.00 |
| Libsyn | $20.00 |
| SendOwl | $24.00 |
| Teachable | $79.80 |
| WebinarJam | $397.00 |
| Total Hosting | $842.80 |
| TOTAL EXPENSES | $6,912.92 |
| NET PROFIT | $1,365.74 |